When Claude Code, Cursor, Copilot, or ChatGPT in your browser hangs, watson tells you who to blame: your network, your machine, or the provider. It reads timing, never content. No decryption. Nothing leaves your laptop.
NETWORKRetransmits, RTT spikes, VPN in the path. Fix it.
YOUR MACHINECPU pegged, local tools running. Free it up.
PROVIDERHealthy path, service busy. Stop debugging.
TL;DR
Ping lies by omission. A 20 ms path can sit in front of an 8-second wait. Network health ≠ service health.
Native AI apps have no DevTools. Claude Code, Copilot and desktop chat apps keep their timing to themselves.
watson measures it from the outside: packet timing and sizes of encrypted traffic, per response, per app.
Works in the browser too. A small extension covers web chatbots in any Chromium browser, whether they stream over fetch, SSE, XHR or WebSocket.
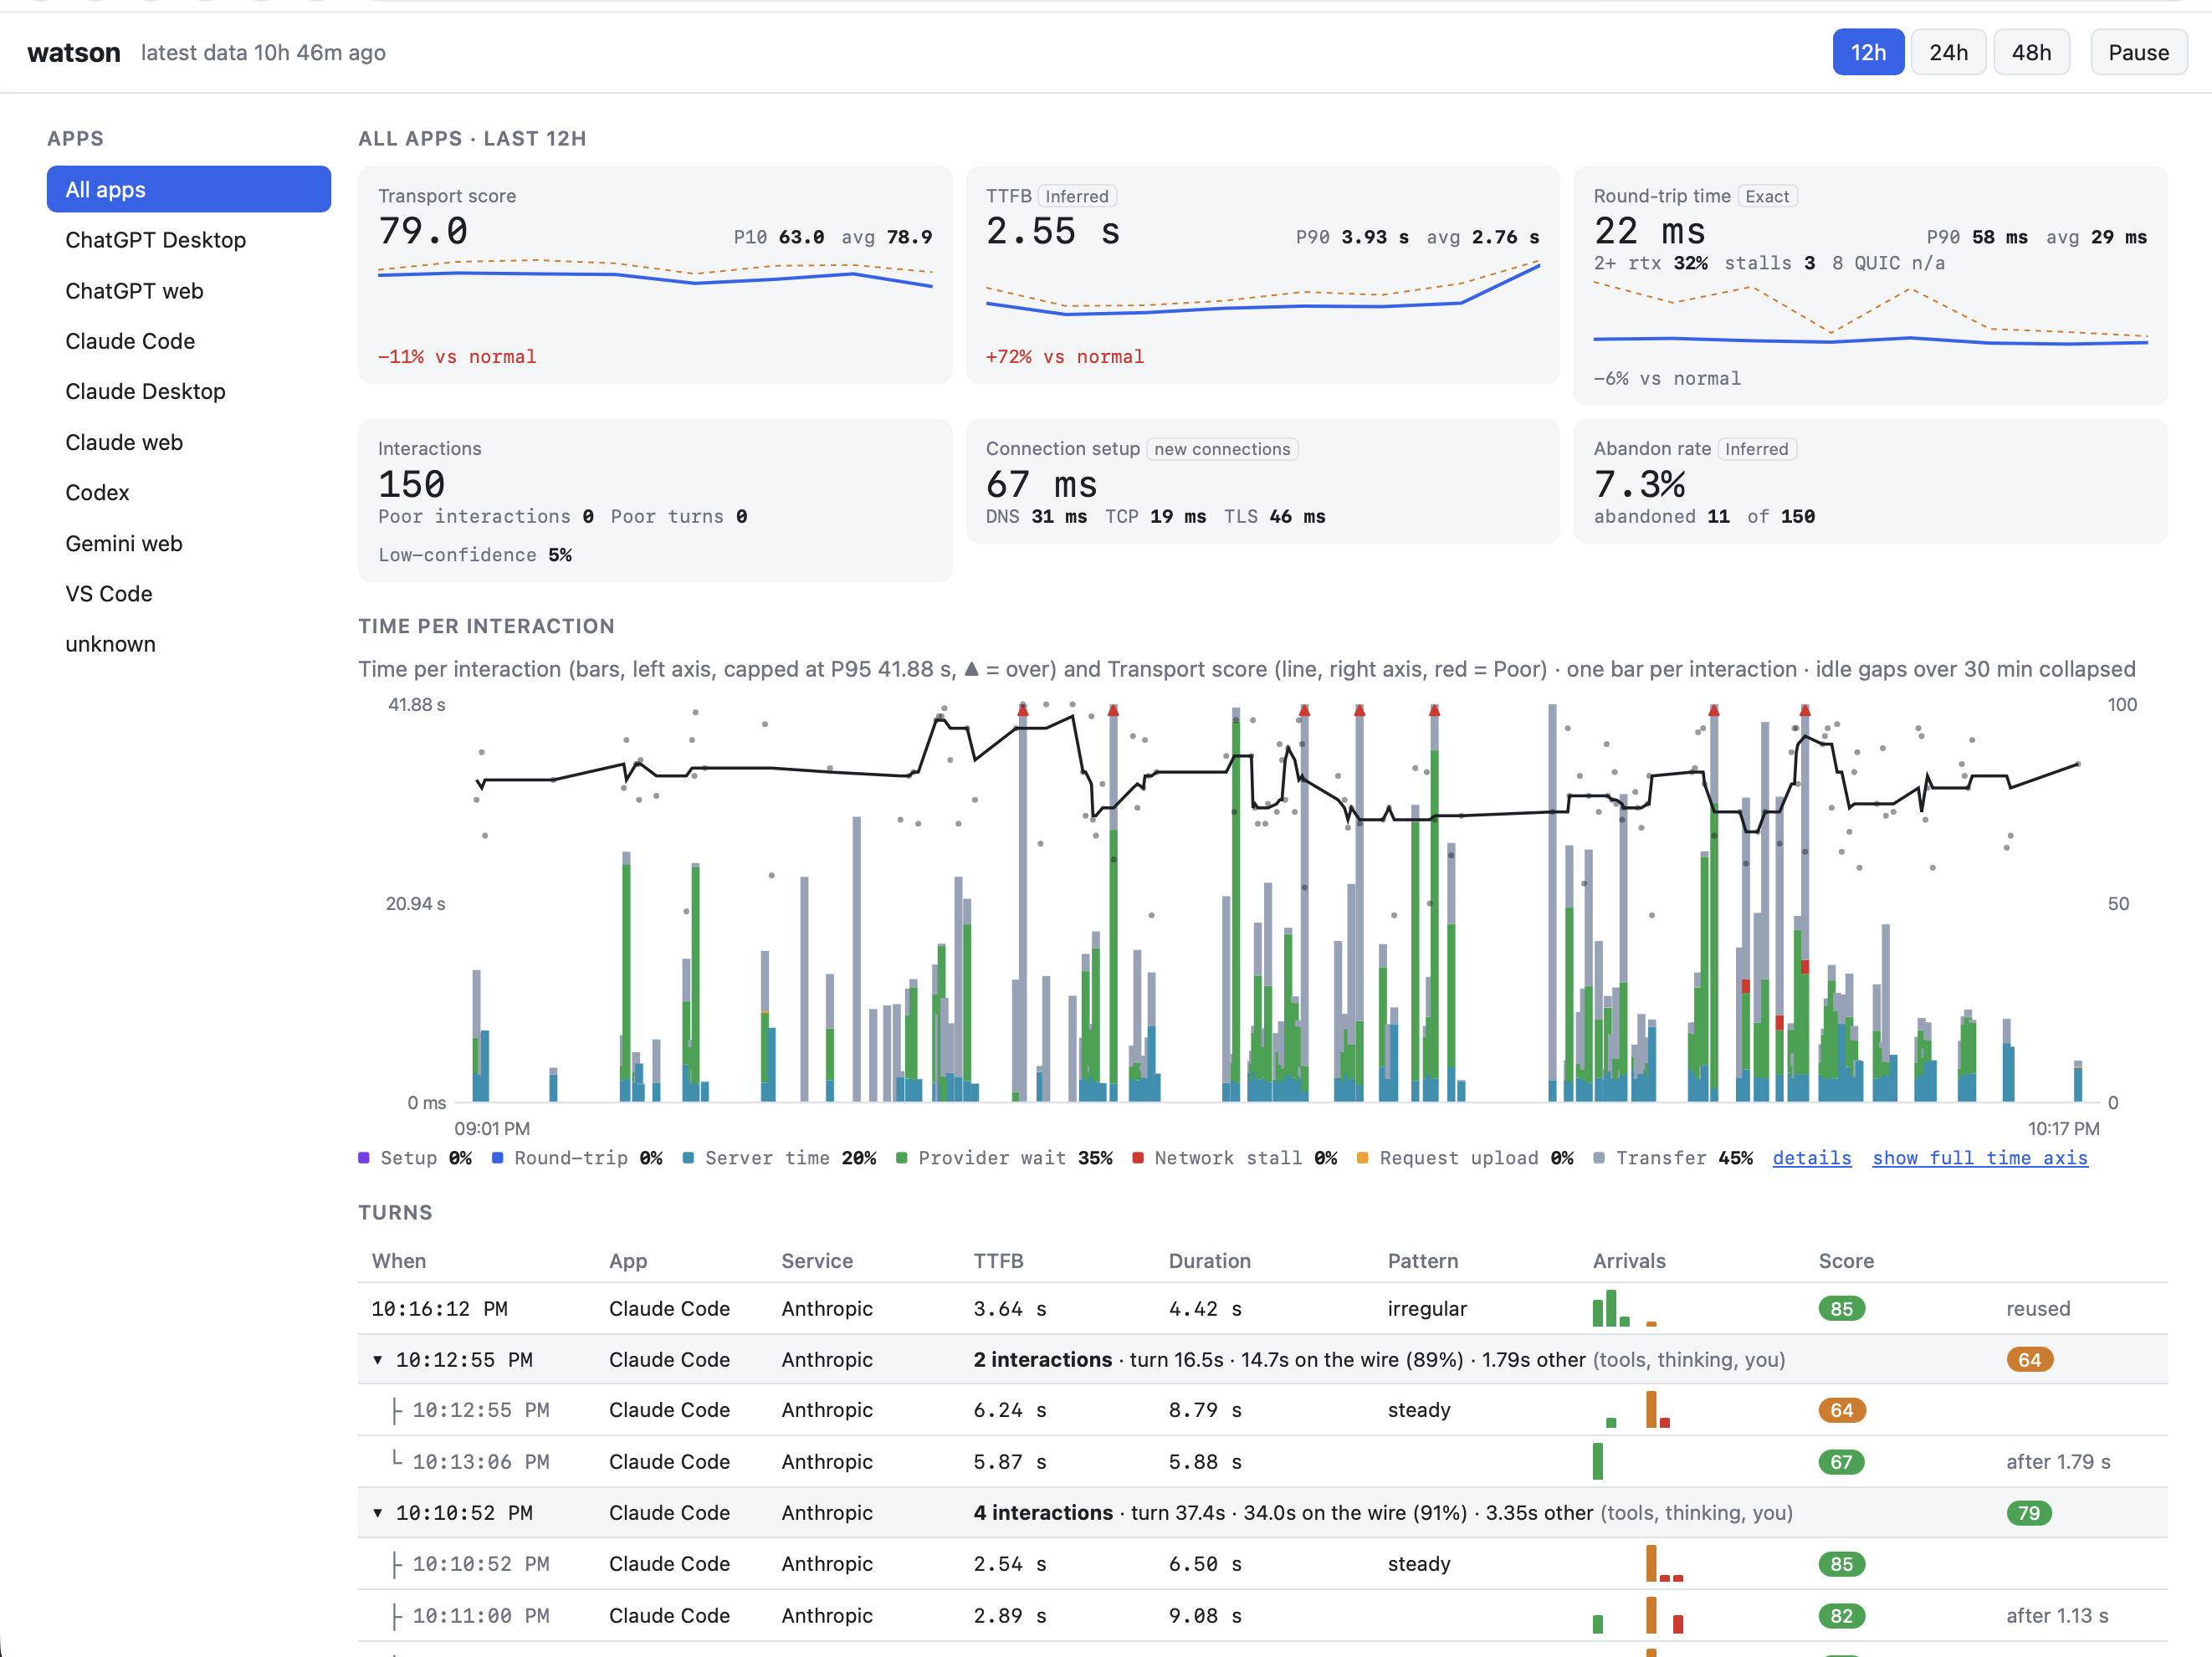
In 960 real interactions, the network was almost never the problem: 7 stalls, 23 ms median RTT.
Where it works
Desktop apps and the browser, one timeline
Native clients and web chatbots land in the same log, scored against the same baselines, so you can compare Claude Code with Claude in a browser tab.
Native AI apps
passive packet capture · no install in the app
Recognises each app by the process that owns the connection, and the provider by the TLS server name.
Apps
Claude CodeClaude DesktopChatGPT desktopCodexCursorVS Code + Copilot
AI chatbots in the browser
watson browser extension · timing & size only
Records when each streamed chunk arrived and how big it was. Passive capture adds round-trip and retransmit evidence where it can see the connection.
Any Chromium browser
ChromeEdgeBraveArcOperaVivaldi
Streaming transports
fetchXHRSSEWebSocket
Browser caveat: over HTTP/3 (QUIC), or on a connection opened before watch started, the network is hidden. You still get the exact first byte, duration and pauses, but the score falls back to time-to-first-byte only and is marked ~. For full network evidence, start watch first, then relaunch the browser.
The playbook
Triage a slow AI response in three questions
Ask them in this order. Most "slow AI" complaints are settled by question two.
Is the network healthy?
Check round-trip time and retransmits against your normal. Only touch Wi-Fi, VPN or ISP if they're off.
RTT above normal → networkpauses marked N → networkboth normal → go to 02
Is the service slow?
Long time-to-first-byte or provider wait on a healthy path means the provider is the bottleneck. Nothing local will fix it.
high TTFB or P pauses → wait or switch modelnormal → go to 03
Is it how you're using it?
Network fine, service fine, still slow? The time is going somewhere off the wire: local tools, model thinking, or giant context.
trim contextstart a fresh conversationfewer tool calls per turn
How it decides
Every pause gets a culprit, with evidence
On an encrypted stream, a thinking model and a stalled network look identical. watson checks what else was happening during every pause over 1 second, in this order:
N
Network stall
A retransmit or an RTT spike big enough to explain the pause.
Check Wi-Fi, VPN, ISP.
T
Tool activity
The same app was talking to non-AI hosts. A heuristic, labelled as one.
That's the agent working.
C
Machine contention
System CPU above 90% during the pause.
Kill the build or indexer.
P
Provider wait
None of the above. Healthy path, idle machine. The service was working.
Wait. Never lowers the score.
Each response also gets a 0–100 Transport Score against your own rolling baseline per provider and app: connection health 35%, TTFB 30%, network stalls 25%, setup 10%. Provider wait never counts against it.
Two days, real work
It mostly wasn't the network
Roughly 960 interactions across Claude Code, Claude Desktop, ChatGPT, Codex and VS Code, before browser support landed.
960interactions
23 msmedian round-trip
7network stalls
18%of time was provider wait
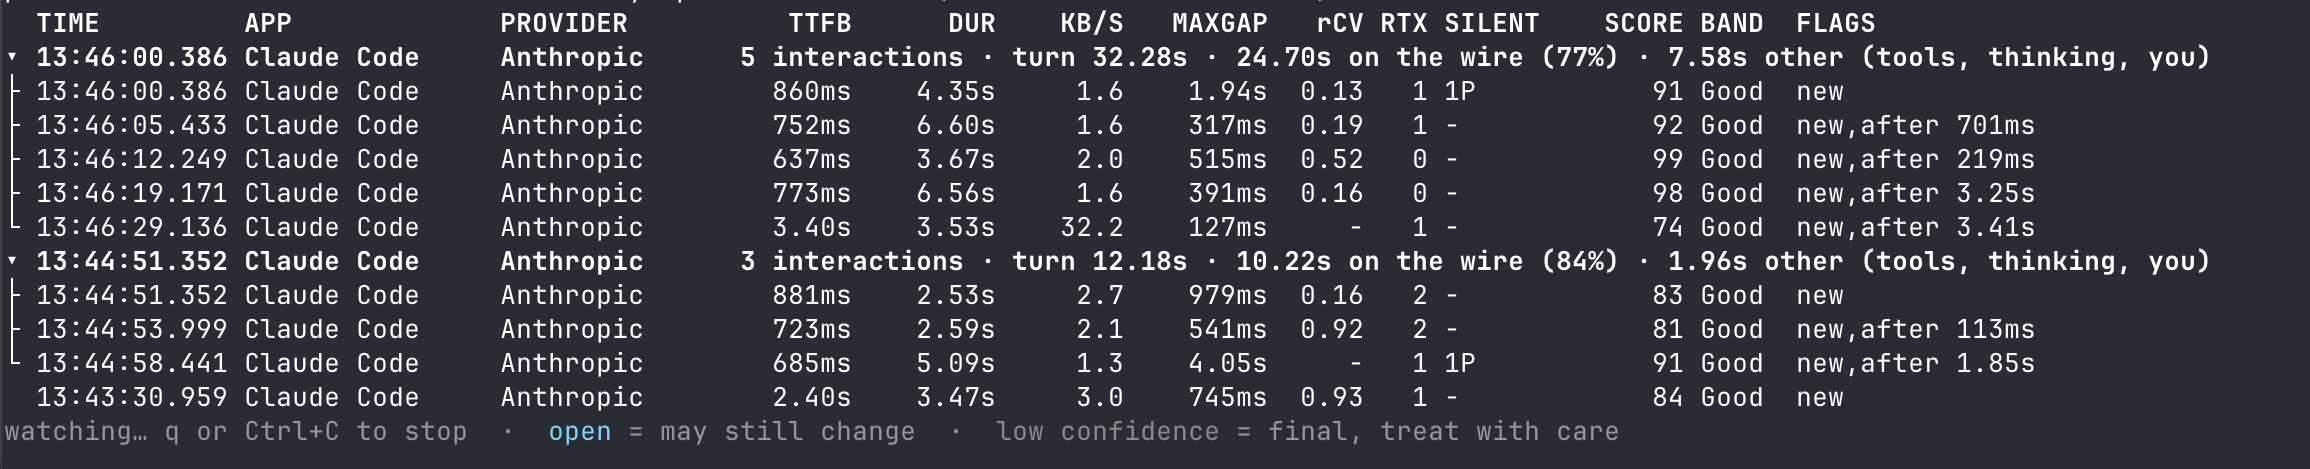
one "slow" 32s responsewhere the time went
24.7s on the wire
7.6s other
"Other" is time with nothing on the network: a tool running, the model deciding, or you. No network fix touches it.
watson serve: tiles vs your normal, every interaction split into setup, round-trip, server time, provider wait, stall and transfer, plus the worst offenders.
Try it
Two terminals, five minutes
One Go binary plus an optional browser extension. macOS and Linux. Capture needs root; the live page doesn't.
# build$ go build -o watson ./cmd/watson
# terminal 1: watch every AI response on this machine$ sudo ./watson watch --min-duration 1
# terminal 2: open the live page it prints$ ./watson serve
# optional, for web chatbots: in any Chromium browser# chrome://extensions → Developer mode → Load unpacked → extension/
watson watch: one row per response. SILENT 1N 2P = one network stall, two provider waits.
Trust model
What watson never does
Decrypt trafficNo proxy, no root certificate. It reads only the TLS server name to know which service you're talking to.
Store contentTimestamps, sizes and TCP state only. Prompts and answers are never seen.
Read the pageThe extension keeps each chunk's arrival time and byte count, never the text, headers or URL path, and talks only to watson on this machine.
Phone homeThe log is a local file only you can read. The page refuses anything but loopback.
GuessEvery number says if it was measured, inferred, or invisible. Unknown stays unknown.
Known blind spots: no tokens or model names; QUIC/HTTP3 hides retransmits and RTT; corporate VPNs and Zscaler tunnels hide destinations (watson detects this and tells you which interface to capture on instead).
Next up: beyond AI
Stop guessing. Start blaming accurately.
Profiles for bulk transfer, real-time media, remote sessions and push are coming, so the same question works for any desktop or web app.