Network path intelligence that tells you what broke, not just that something did.
NetPulse combines multi-mode continuous probing, AI-learned baselines, public BGP feed correlation, and LLM-generated root cause analysis to cut incident diagnosis from 90 minutes to under 60 seconds. Built for the network and reliability teams.
Built for three teams that share one problem
Network path degradation is rarely a single team's problem and rarely has a clear owner when it happens. The network engineer gets paged but can't reach the ISP. The NOC manager needs evidence for a post-mortem but has only a latency graph. The SRE sees service SLOs eroding but can't determine if the fault is the application or the path it's running on.
Primary user
Gets paged at 3 AM. Spends the first hour figuring out whose fault it is. Needs hop-level evidence, BGP context, and ISP escalation material automatically.
Economic buyer
Needs MTTR metrics, a dashboard for leadership during incidents, and documented evidence of ISP SLA violations. Wants the team running fewer 3 AM war rooms.
Key beneficiary
When a service degrades, needs to rule out network as a cause fast. A service latency spike that correlates with a BGP route change at hop 5 is not an application bug. Needs that answer in seconds, not after a 45-minute investigation.
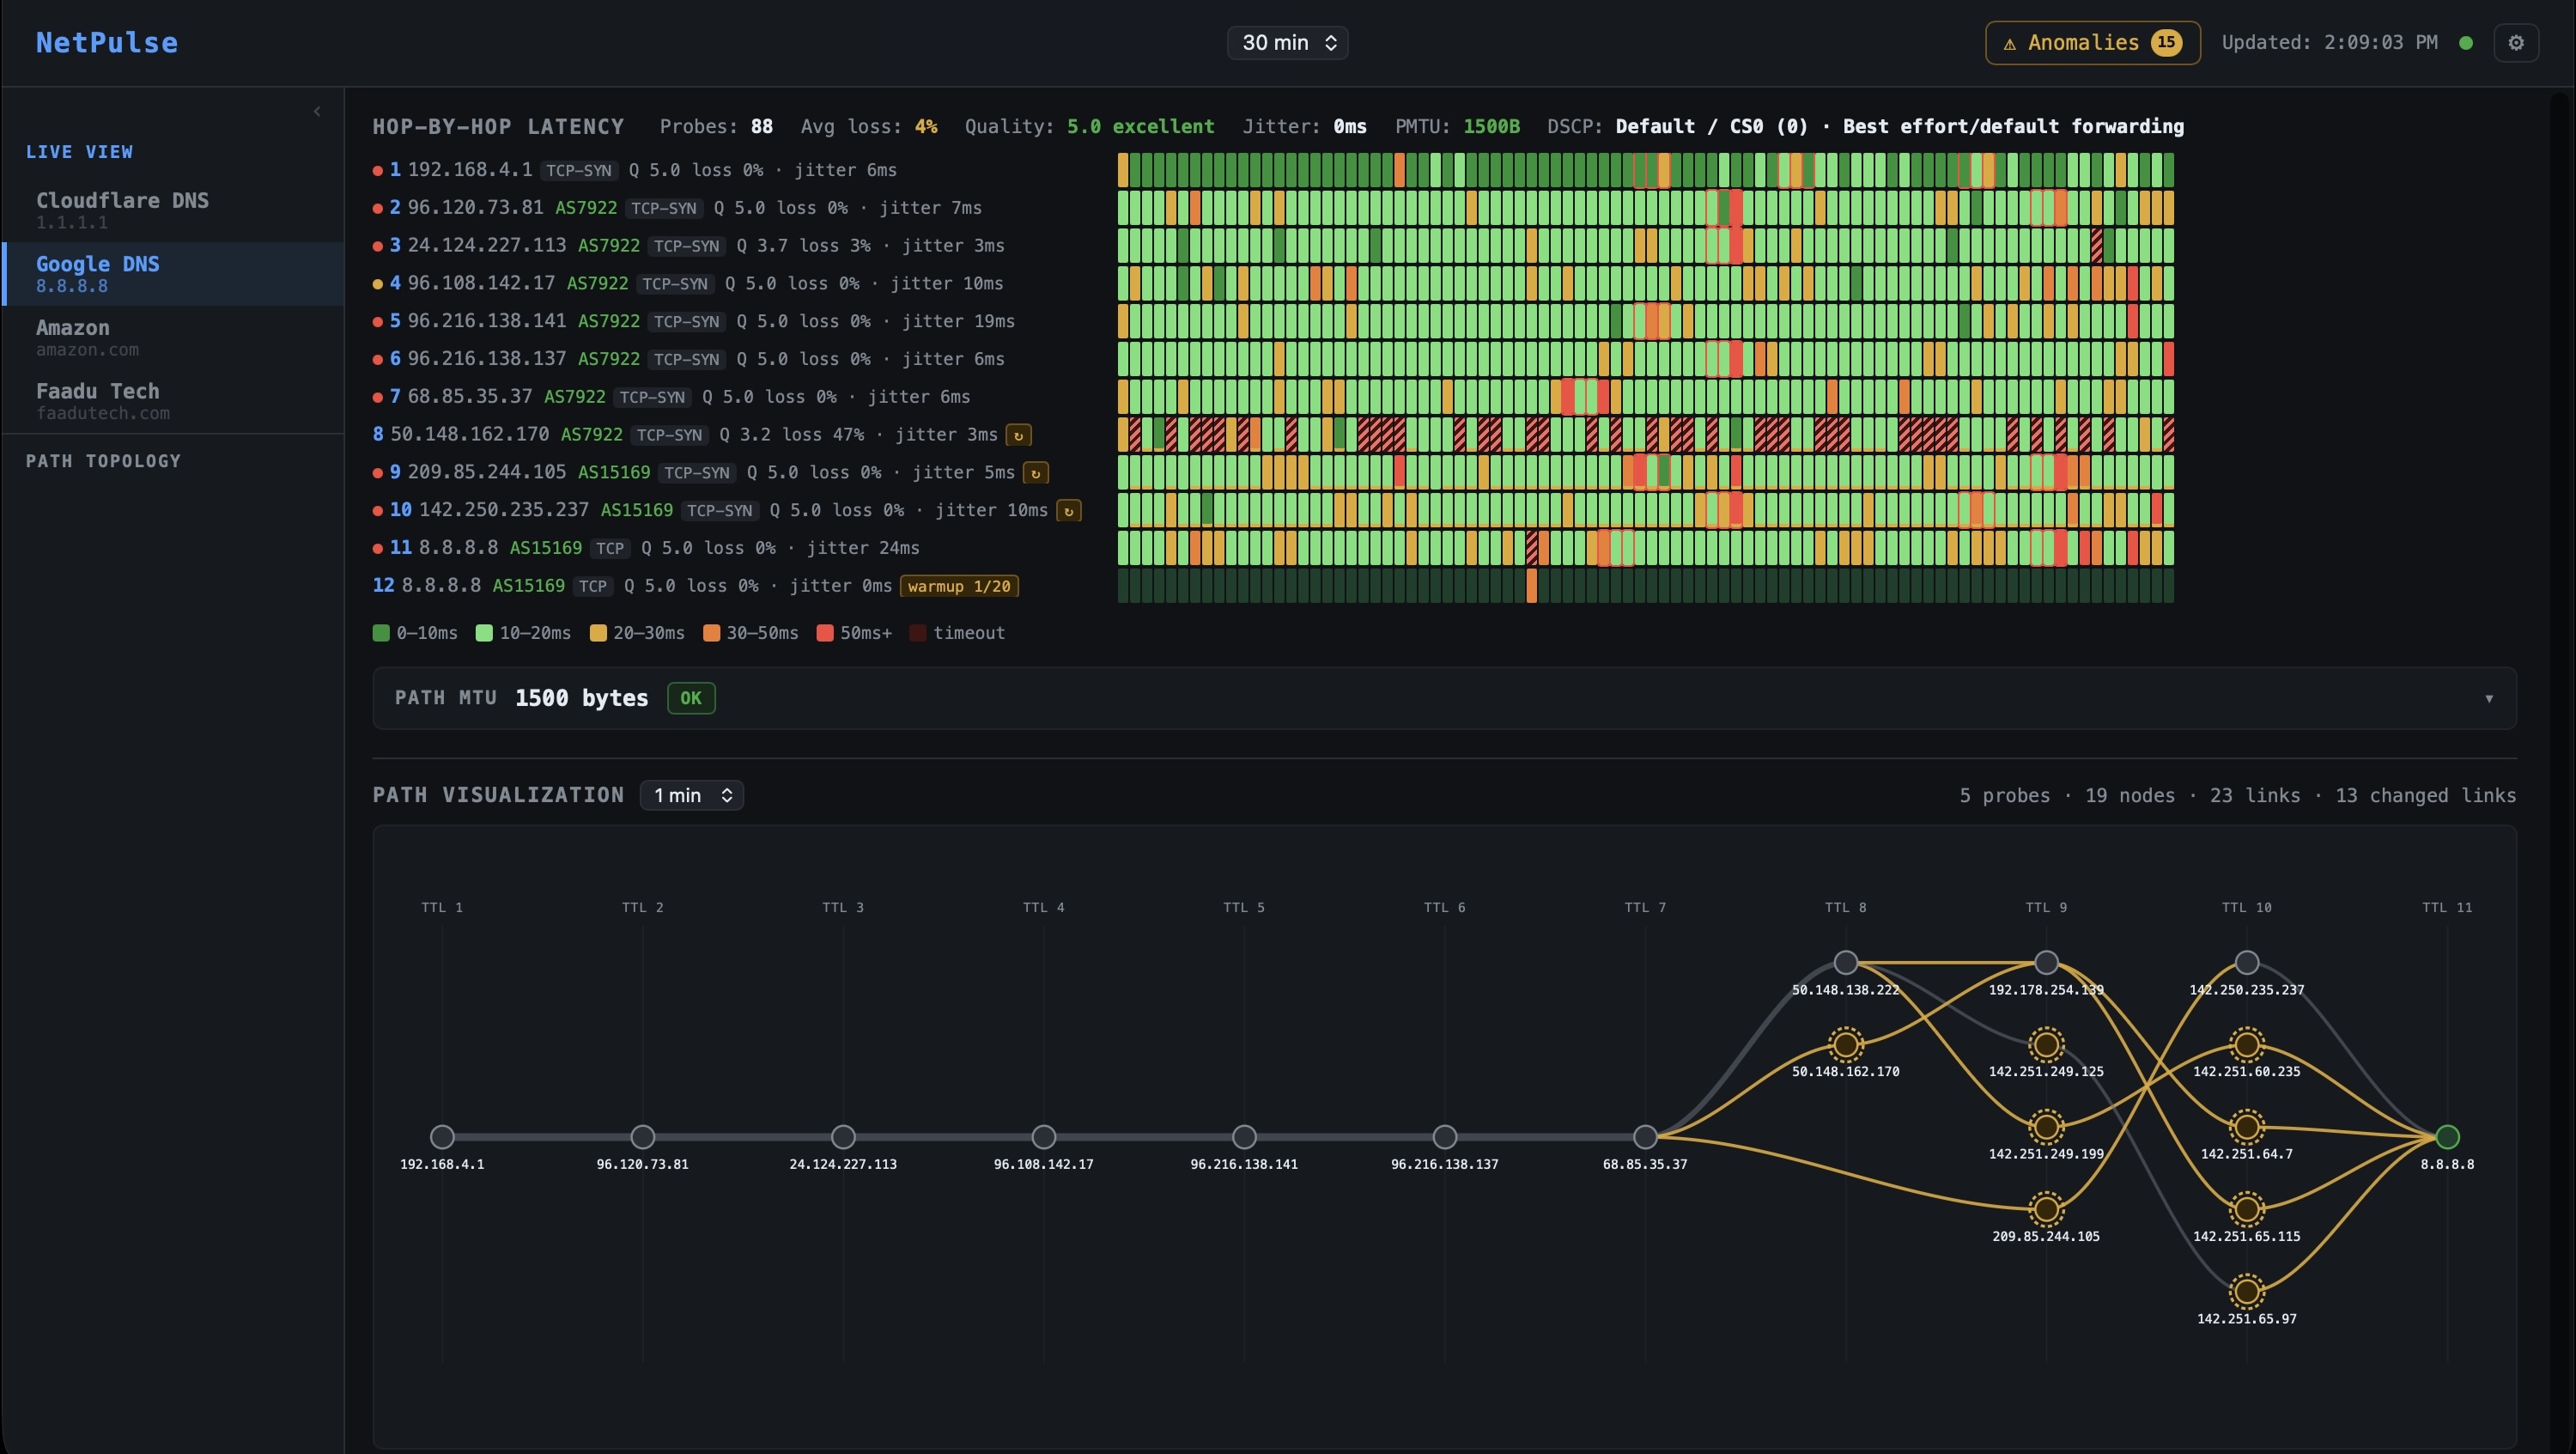
The probe layer precision by design
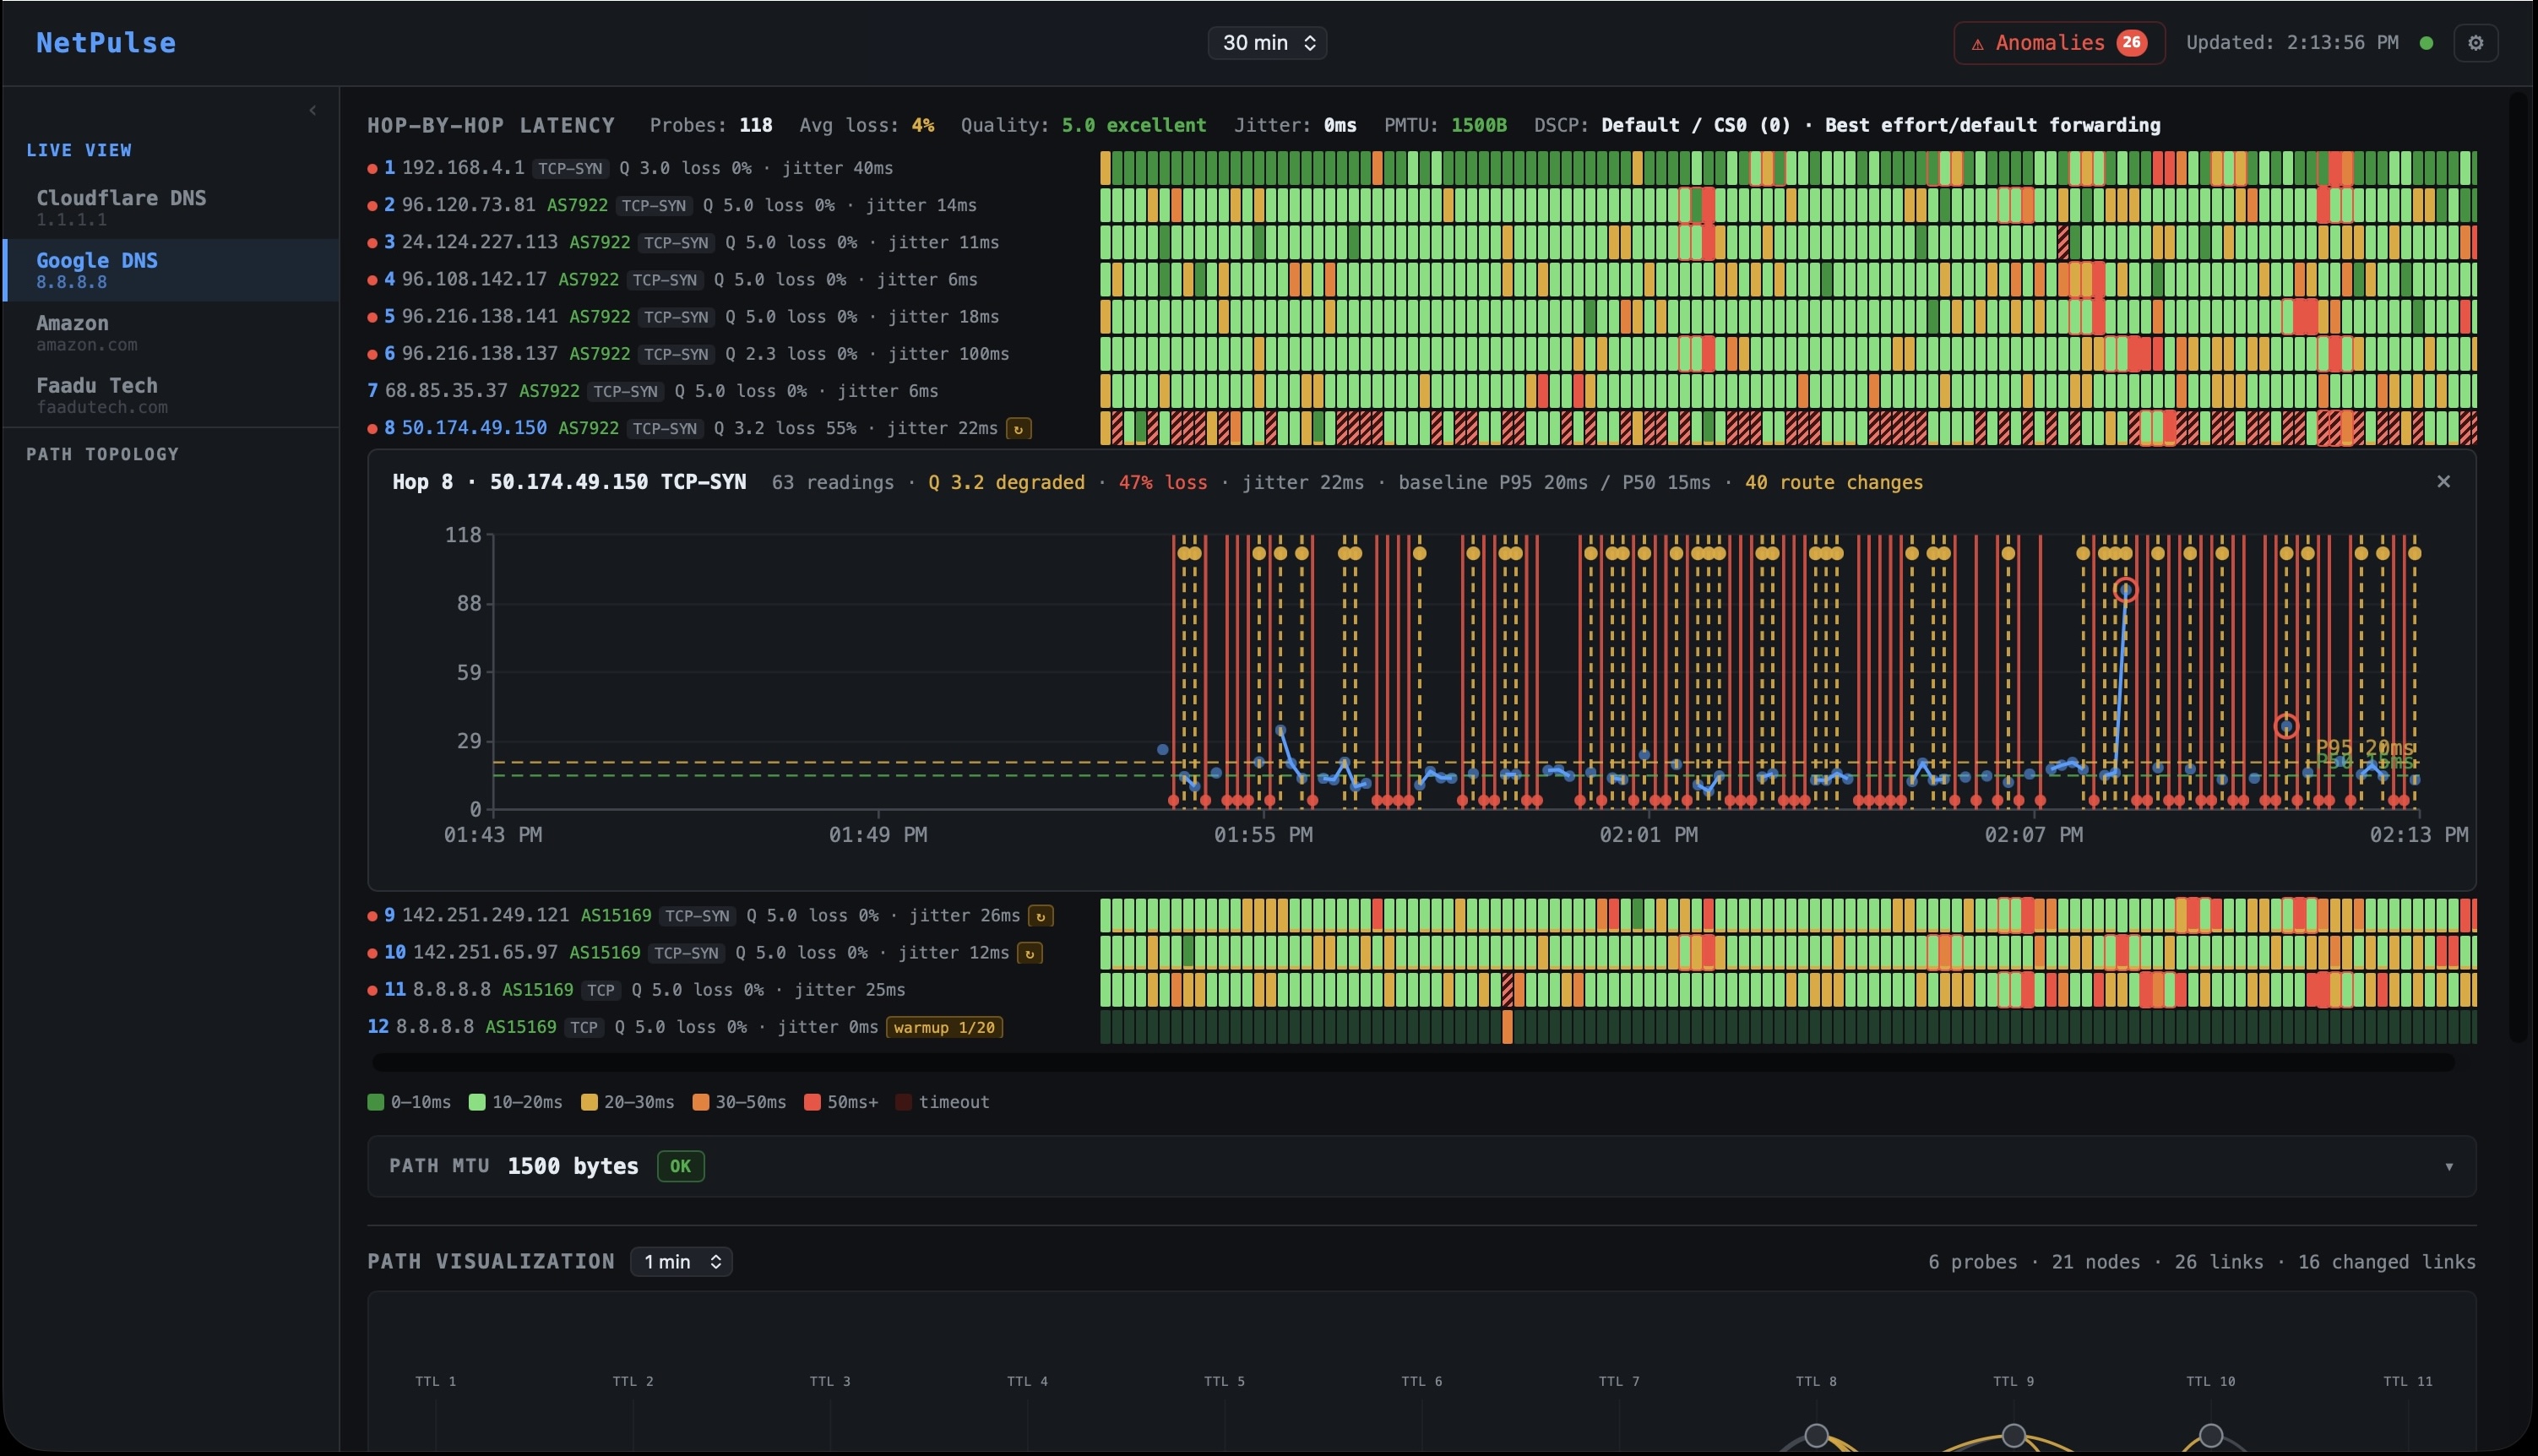
The quality of everything downstream baselines, anomaly detection, BGP correlation, RCA depends entirely on the quality and accuracy of the probe data. NetPulse runs continuous, multi-mode probes every 5 seconds per target, and the probe configuration is designed to give you signal that matches your actual traffic, not a generic ping.
Four probe modes are available, each with distinct behavior and the right use case for each:
TCP (SYN / SACK variants)
Production-accurate. Firewall-friendly. Probes specific ports. Three sub-modes for different path characteristics.
PMTU Discovery
Measures the maximum transmission unit across the full path. Critical for detecting MTU black holes and validating tunnel configurations.
DSCP Probing
Probes under specific QoS traffic classes. Verifies that priority markings are honored end-to-end or reveals where they're being stripped.
ICMP packets and actual application traffic do not always take the same path through your network or your ISP's network. ICMP can be deprioritized, filtered by enterprise firewalls, or take a different load-balanced path than TCP traffic. TCP probing solves this by using real TCP packets the same protocol your application traffic uses which means the path you're measuring is the path your users and services are actually on.
NetPulse offers three TCP sub-modes, each suited to different network environments and measurement objectives:
| Mode | Behavior | Best for |
|---|---|---|
| Force SYN | Sends TCP SYN only. Measures RTT to first SYN-ACK or RST. Never completes the handshake. No TCP options in the probe packet. | Cleanest network-layer RTT measurement. Firewall-friendly. Mirrors client connection initiation exactly. |
| Force SACK | TCP SYN with the SACK (Selective Acknowledgment) option explicitly set in TCP header options, regardless of path support. | Testing whether SACK options are preserved end-to-end. Relevant for high-throughput replication and bulk transfer paths where SACK support matters for performance. |
| Prefer SACK | Includes SACK option in the SYN. Falls back gracefully if the remote endpoint or an intermediate device strips the option. | Standard production monitoring. Adaptive behavior. Reveals mid-path devices that silently strip TCP options a common source of mysterious throughput degradation. |
Path MTU (Maximum Transmission Unit) is the largest packet that can traverse the full path from source to destination without being fragmented. The standard Ethernet MTU is 1500 bytes. But the moment you introduce any kind of tunneling IPSec, GRE, VXLAN, WireGuard overhead headers reduce the effective MTU available to the payload. If your application sends packets larger than what the path can carry, one of two things happens: the packet gets fragmented (degrading performance), or it's silently dropped (causing mysterious failures).
The second scenario silent drops is known as an PMTU black hole. It occurs when a router needs to fragment a packet with the Don't Fragment bit set, but instead of sending back an ICMP Fragmentation Needed message (which would allow the sender to discover the correct MTU), it simply drops the packet and generates no feedback. The sender retransmits. The packet drops again. The connection stalls. From the application layer, this looks exactly like random packet loss or a hung connection with no indication that MTU is the root cause.

DSCP (Differentiated Services Code Point) is a 6-bit field in the IP header that tells network devices how to treat a packet. A router configured for QoS will give a voice packet marked EF (Expedited Forwarding, DSCP 46) priority queue treatment lower latency, lower drop probability while a packet marked CS0 (Best Effort) gets whatever capacity is left over.
The problem: QoS policies are applied in-network, by devices you don't control, across hops you can't inspect. Whether your QoS markings are actually being honored or whether they're being silently stripped and re-marked to CS0 by a carrier's edge router is invisible to standard monitoring tools. NetPulse probes with configurable DSCP values and measures the latency at each hop for each traffic class, making QoS behavior visible for the first time.
| DSCP Value | Class | Typical use | NetPulse probe use case |
|---|---|---|---|
| CS0 / BE | Best Effort | Default internet traffic | Baseline every probe includes this for comparison |
| AF11 / AF21 / AF31 / AF41 | Assured Forwarding | Business-critical applications, tiered SaaS | Verify AF treatment is honored vs. BE on the same path |
| EF (DSCP 46) | Expedited Forwarding | VoIP, video conferencing, real-time traffic | Confirm EF packets receive priority queuing end-to-end; detect where EF latency converges with BE (QoS boundary) |
| CS6 / CS7 | Network Control | BGP sessions, routing protocol traffic | Rare in probing; used to verify control-plane path separation from data-plane |
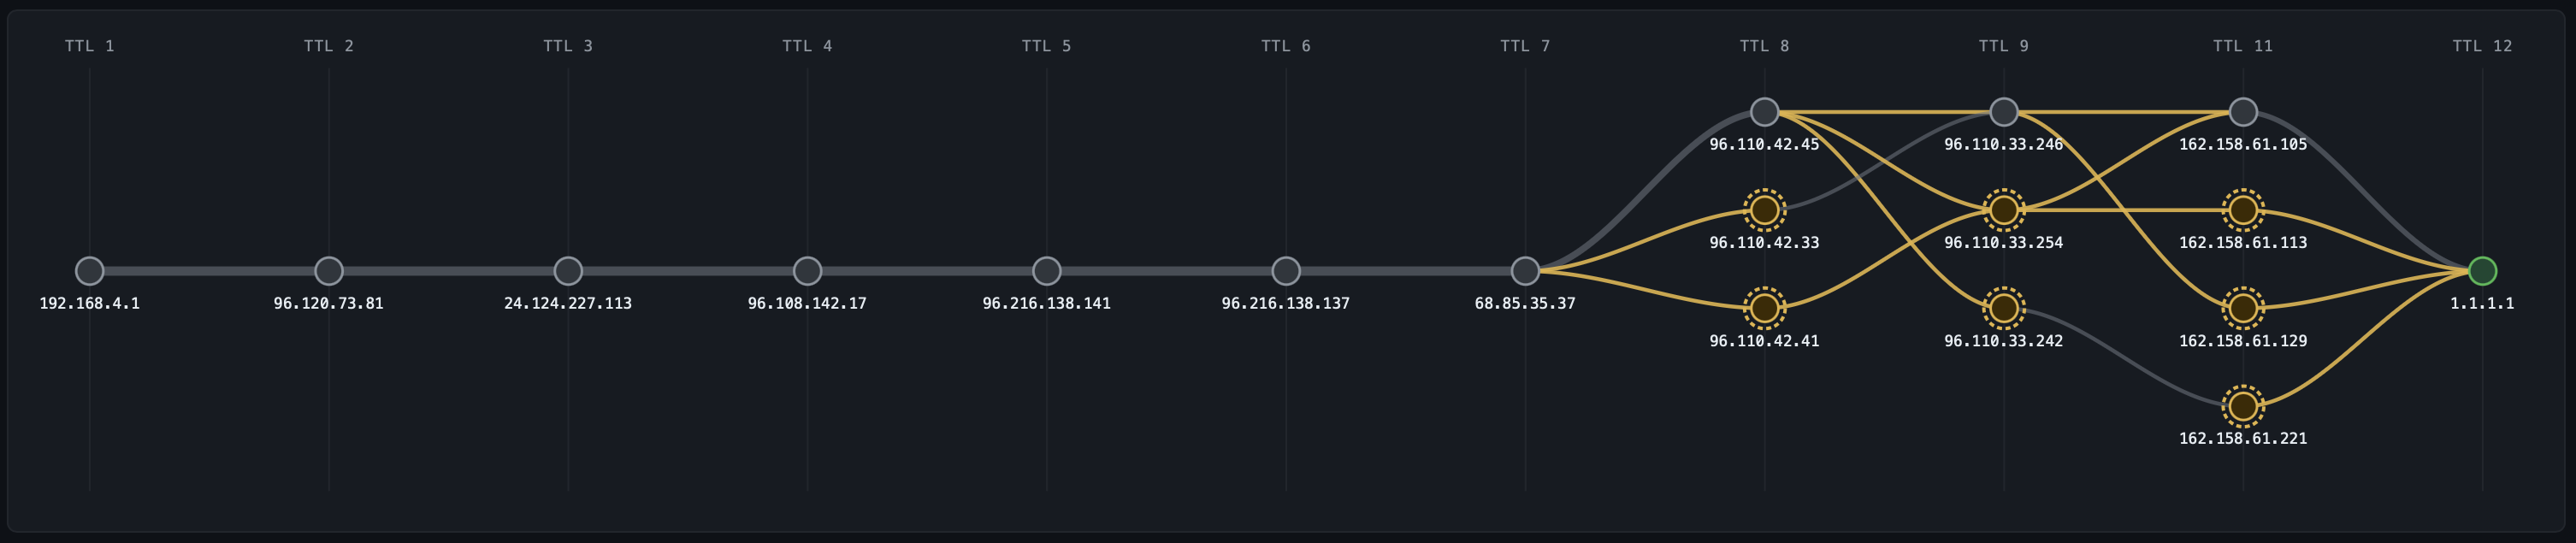
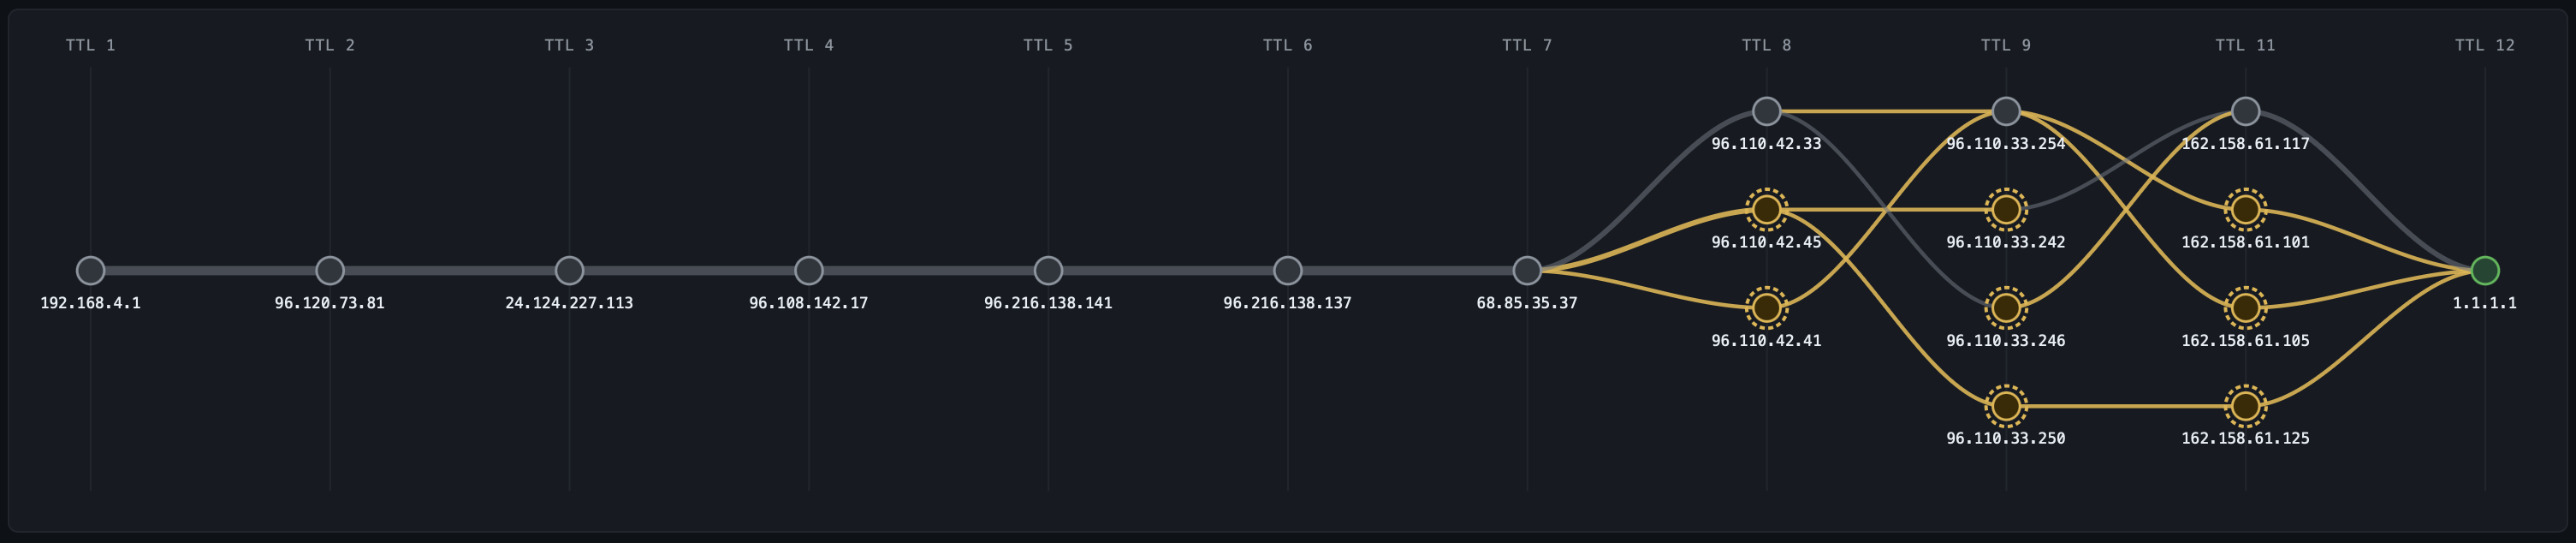
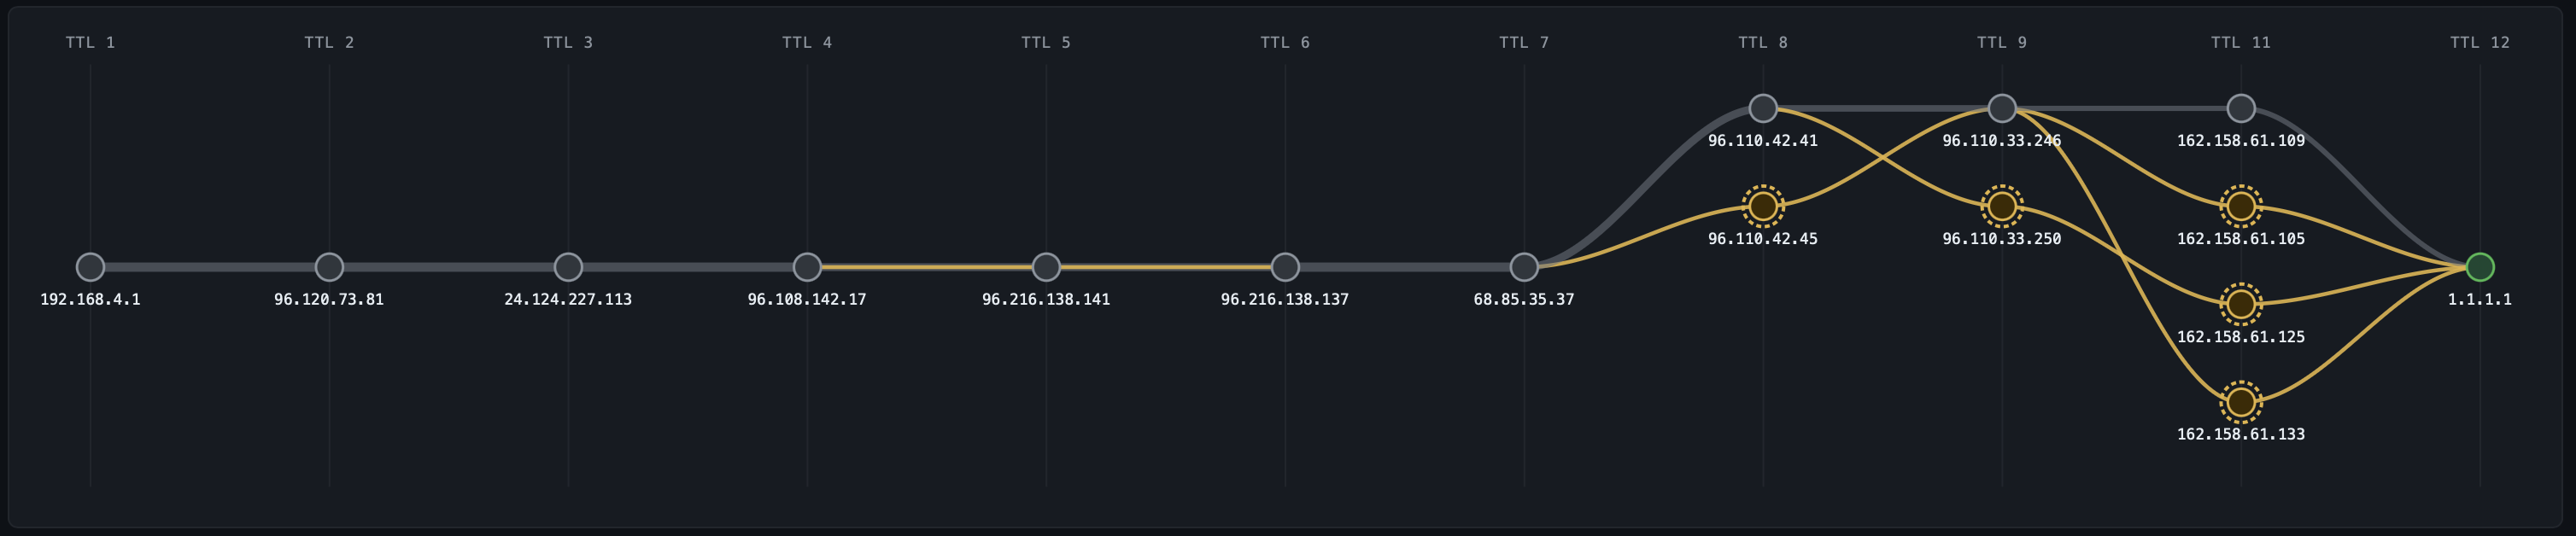
| Hop | CS0 Best Effort | AF41 Business | EF Voice / Priority |
|---|---|---|---|
| 1 | 192.168.4.1 | ||
| 2 | 96.120.73.81 AS7922 (Comcast) | ||
| 3–7 | 24.124.227.113 → 96.108.142.17 → 96.216.138.141 → 96.216.138.137 → 68.85.35.37 all AS7922 | ||
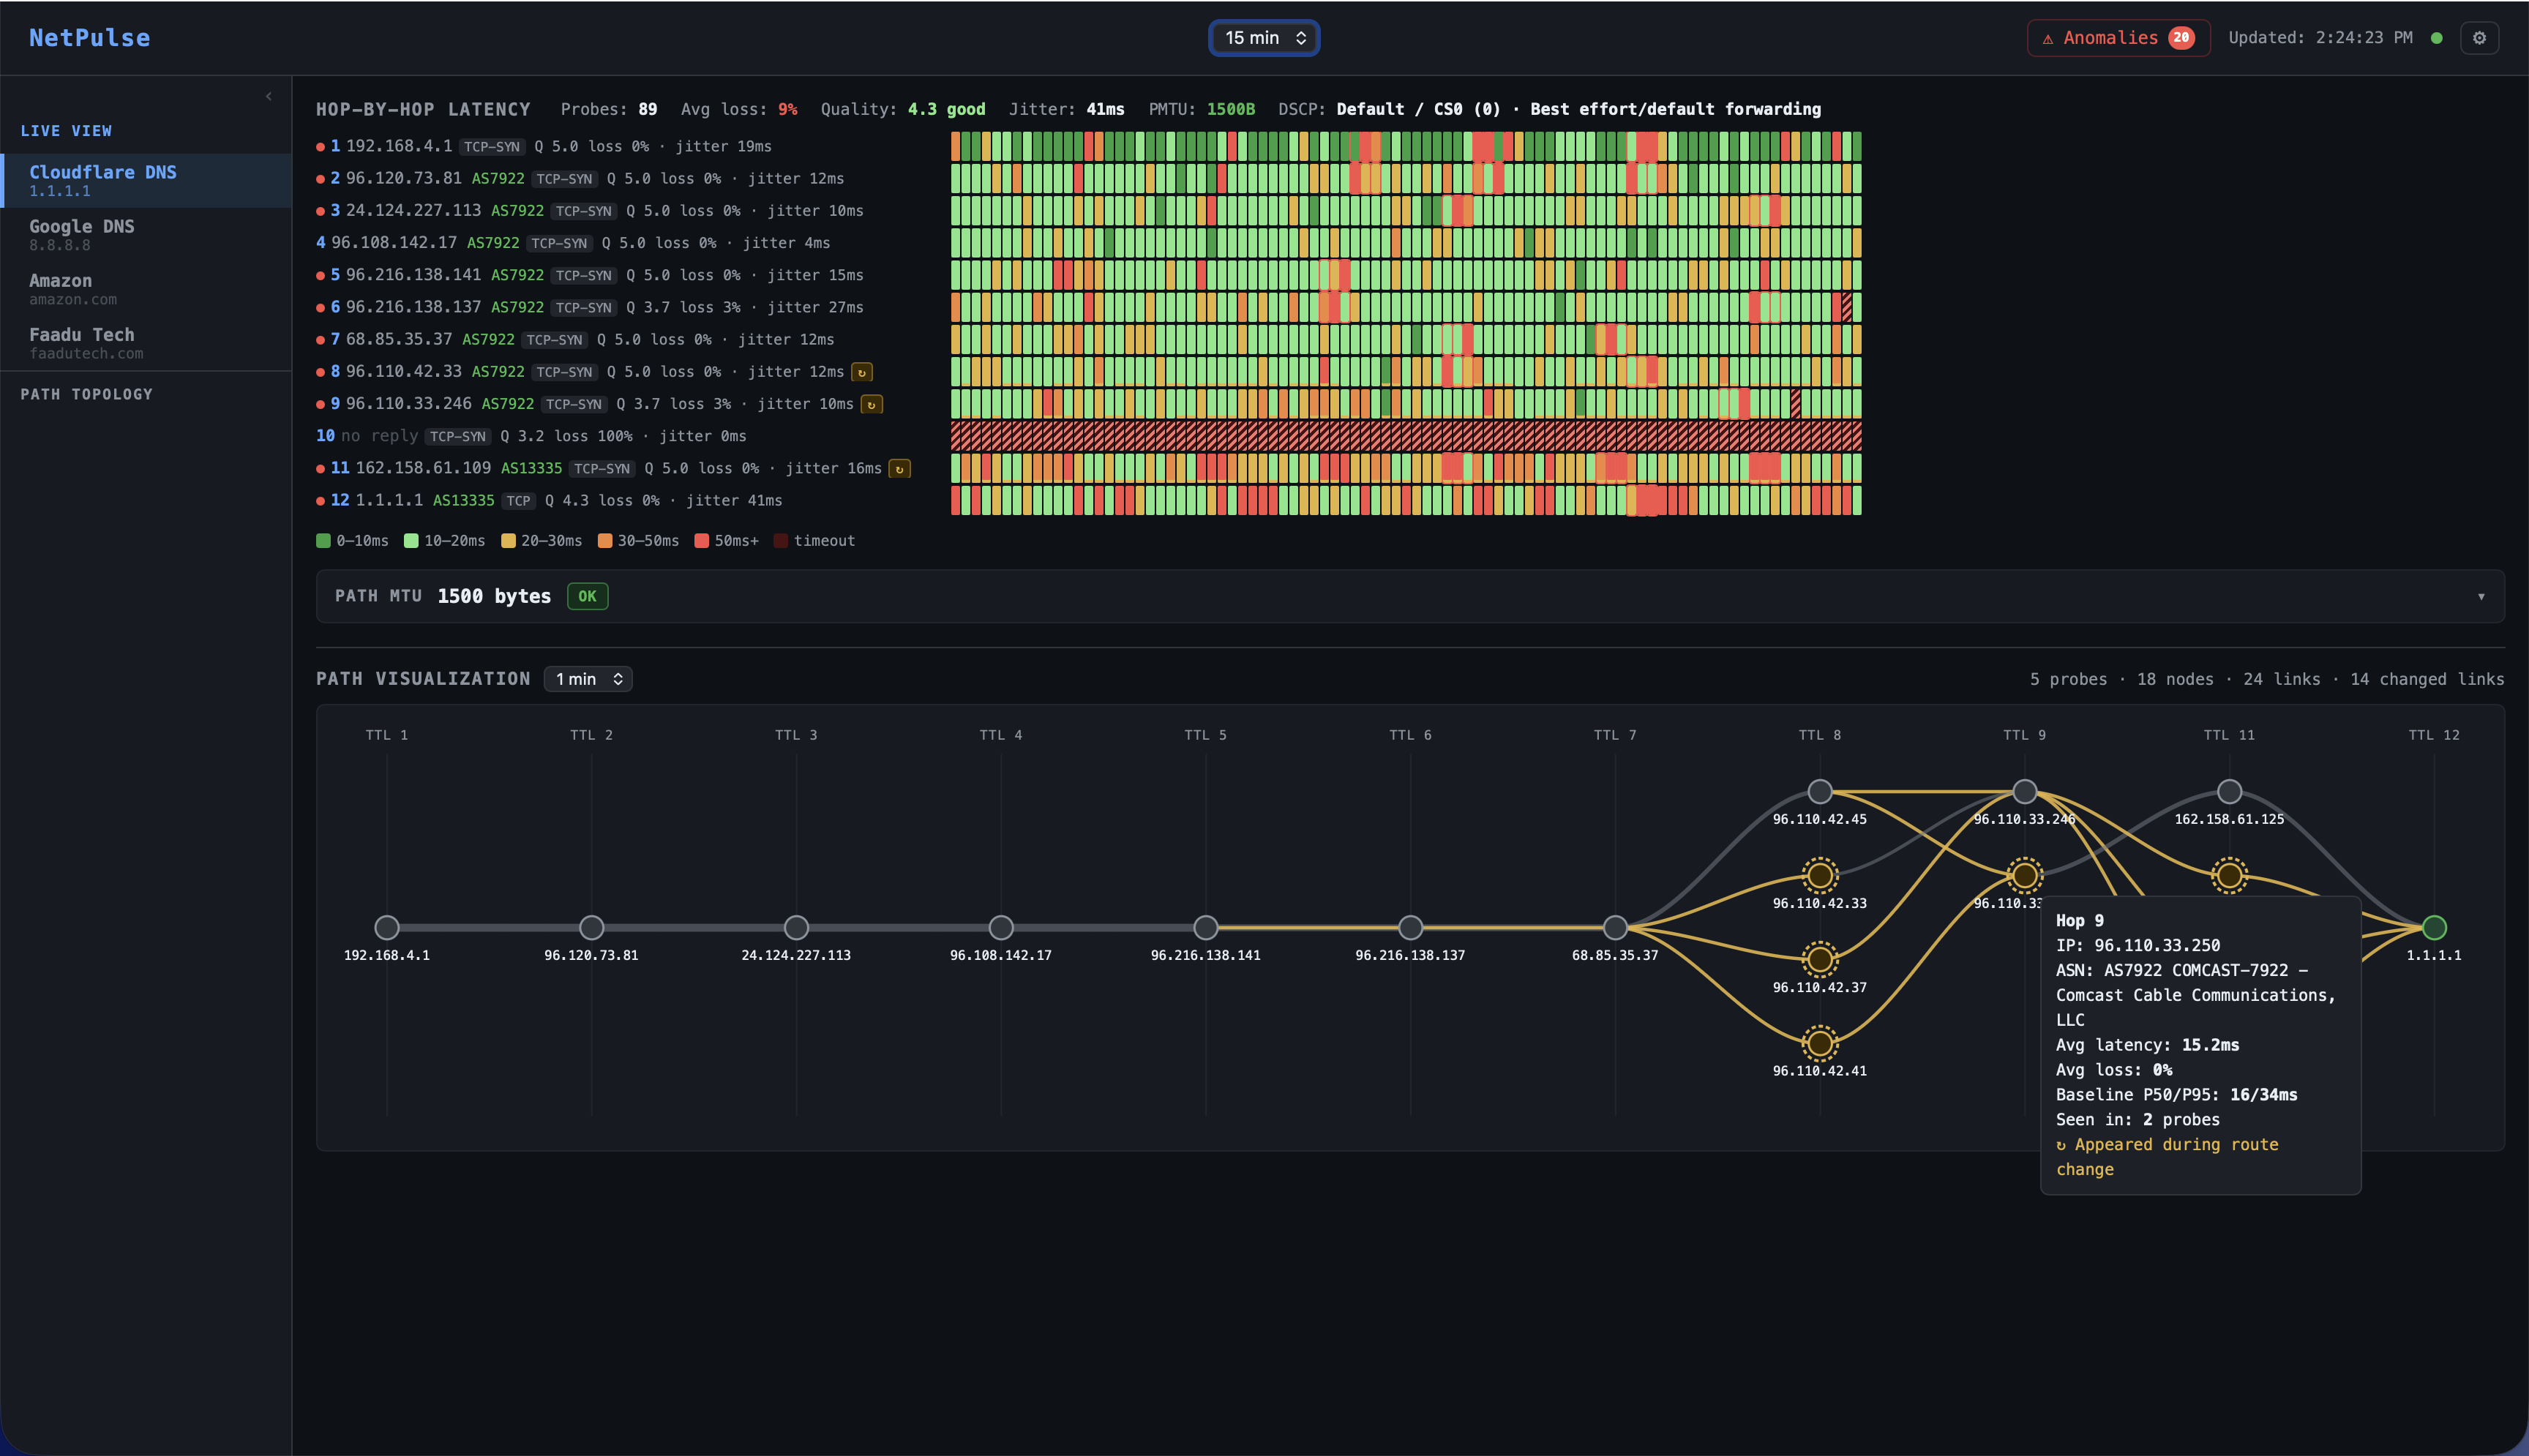
| 8 | 96.110.42.45ECMP | 96.110.42.33ECMP | 96.110.42.41ECMP |
| 9 | 96.110.33.254 | 96.110.33.246 | 96.110.33.250 |
| 10 | |||
| 11 | 162.158.61.113 AS13335 · jitter 16ms |
162.158.61.117 AS13335 · jitter 18ms |
162.158.61.125 AS13335 · jitter 20ms |
| 12 | 1.1.1.1 · 31ms jitter · Q 4.5 | 1.1.1.1 · 29ms jitter · Q 5.0 | 1.1.1.1 · 22ms jitter · Q 5.0 |
AI-learned baselines anomaly detection without the noise
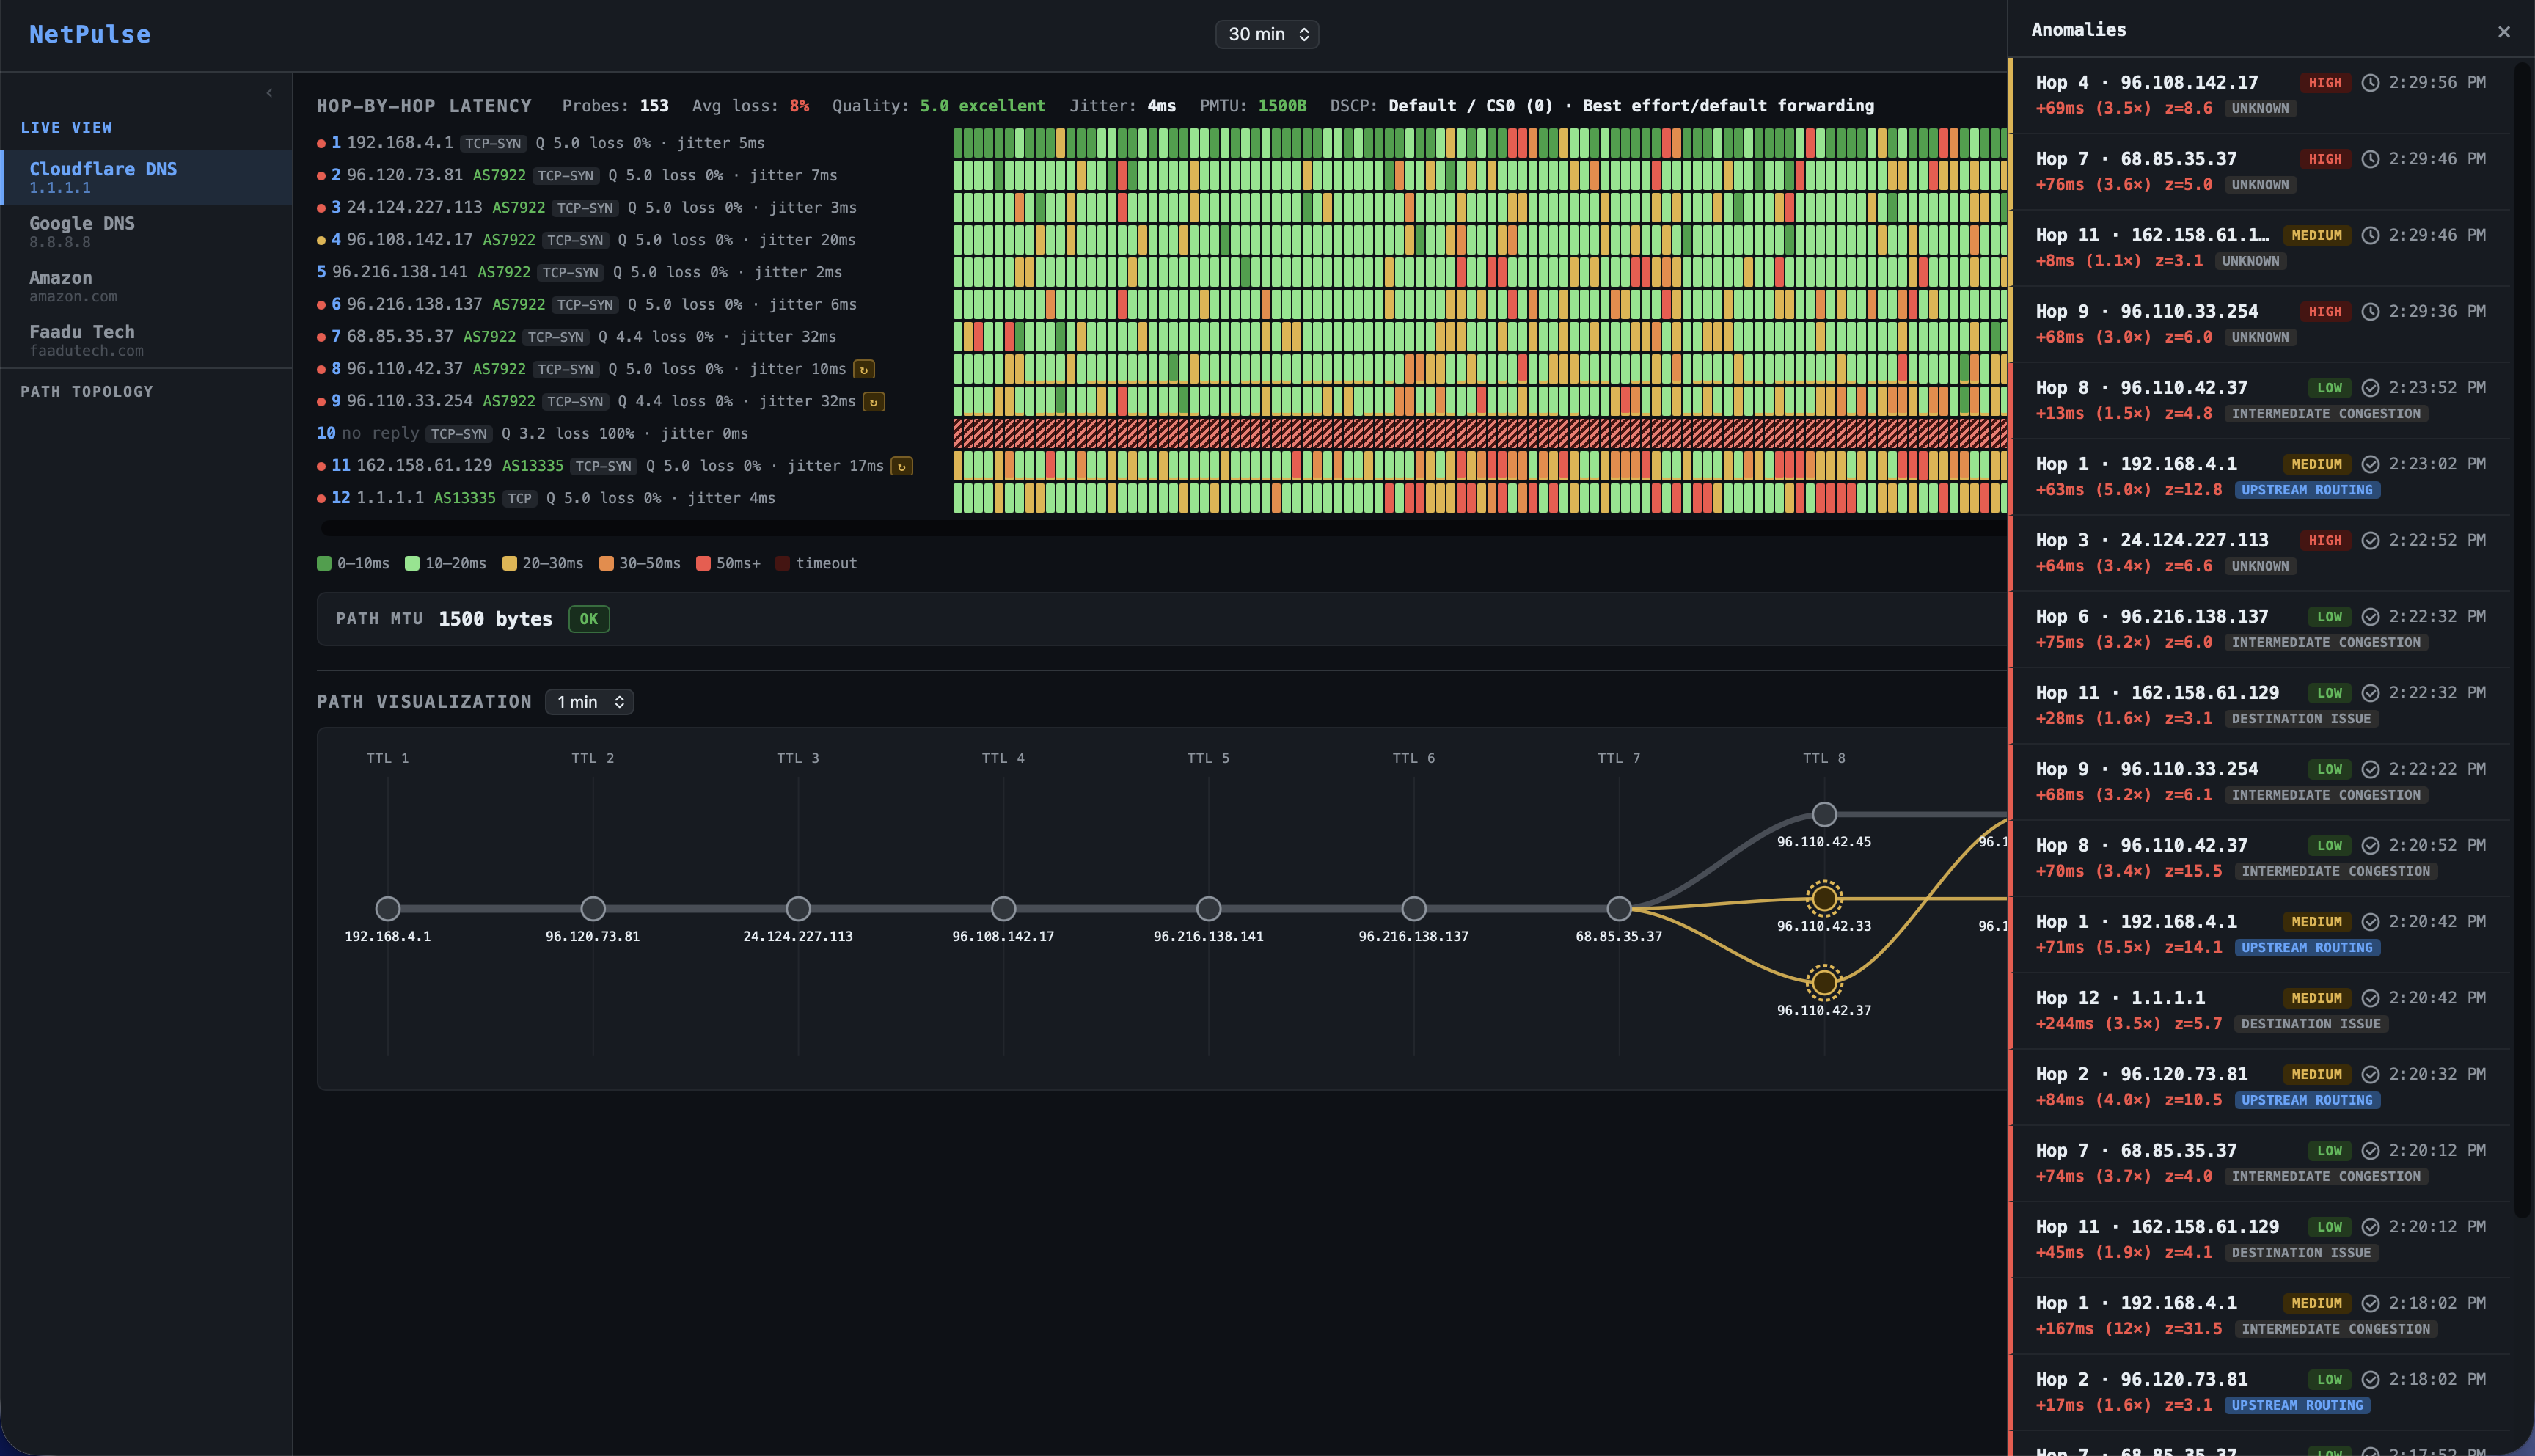
Every probe mode feeds into the same baseline engine. For each probe target and each hop, NetPulse maintains P5, P50, and P95 latency baselines across 672 time-of-day buckets 96 fifteen-minute slots per day, seven days per week, rolling 14-day window. Your 2:47 AM Thursday baseline is distinct from your 2:47 PM Thursday baseline. Your Monday morning rush-hour baseline is distinct from Saturday.
Anomaly detection runs two algorithms in parallel:
Z-score on every event (~100ms): Each probe reading is compared to the current time-slot P95. If deviation exceeds 2 standard deviations, it's flagged as a candidate.
PELT change-point detection on 30-second micro-batches: PELT (Pruned Exact Linear Time) looks for statistically significant inflection points in the recent latency time series distinguishing a sustained shift in the distribution from single-packet noise. This is the filter that eliminates ~85% of false positives that threshold-based systems would page on.
# Tier 2  PELT confirms sustained deviation, not transient spike
def check_pelt(recent_latencies: list[float]) -> bool:
    model = rpt.Pelt(model="rbf").fit(np.array(recent_latencies))
    breakpoints = model.predict(pen=3)
    # Change-point in last 4 readings = sustained shift in distribution
    return len(breakpoints) > 1 and breakpoints[-2] > len(recent_latencies) - 4
An anomaly is confirmed only when both conditions hold for more than 90 seconds. Only then does the system publish to the anomaly pipeline and trigger BGP correlation. This 90-second window is deliberate: it eliminates transient micro-congestion events that self-resolve and would otherwise generate alert fatigue.
BGP correlation upstream intelligence, automatically
The single most common explanation for a mid-path latency spike that has no internal cause is a BGP routing change. When an upstream AS changes its route advertisements rerouting traffic through a different exchange point, a longer AS path, or a geographically distant peer the latency impact appears immediately in your probe data. But without correlating that probe data against the BGP event stream, you have a spike with no explanation.
NetPulse ingests continuous BGP UPDATE and WITHDRAW streams from RouteViews (University of Oregon) and RIPE RIS (RIPE NCC) via BGPStream. Every BGP event affecting every monitored prefix is stored and indexed. When a probe anomaly is confirmed:
- The destination IP is resolved to its BGP prefix
- The BGP events table is queried for that prefix in a ±10-minute window
- If a BGP UPDATE is matched, the anomaly is classified
upstream_routingwith the AS path before and after the change - The affected AS, the new AS path, and the BGP event timestamp are attached to the RCA context
Beyond route changes, NetPulse also detects BGP hijacks when a new origin ASN begins advertising a prefix you monitor. This alert fires immediately on detection, does not wait for a probe anomaly to correlate, and is delivered at the highest priority through all configured channels. An unexpected origin ASN is a security event, not just a routing event.
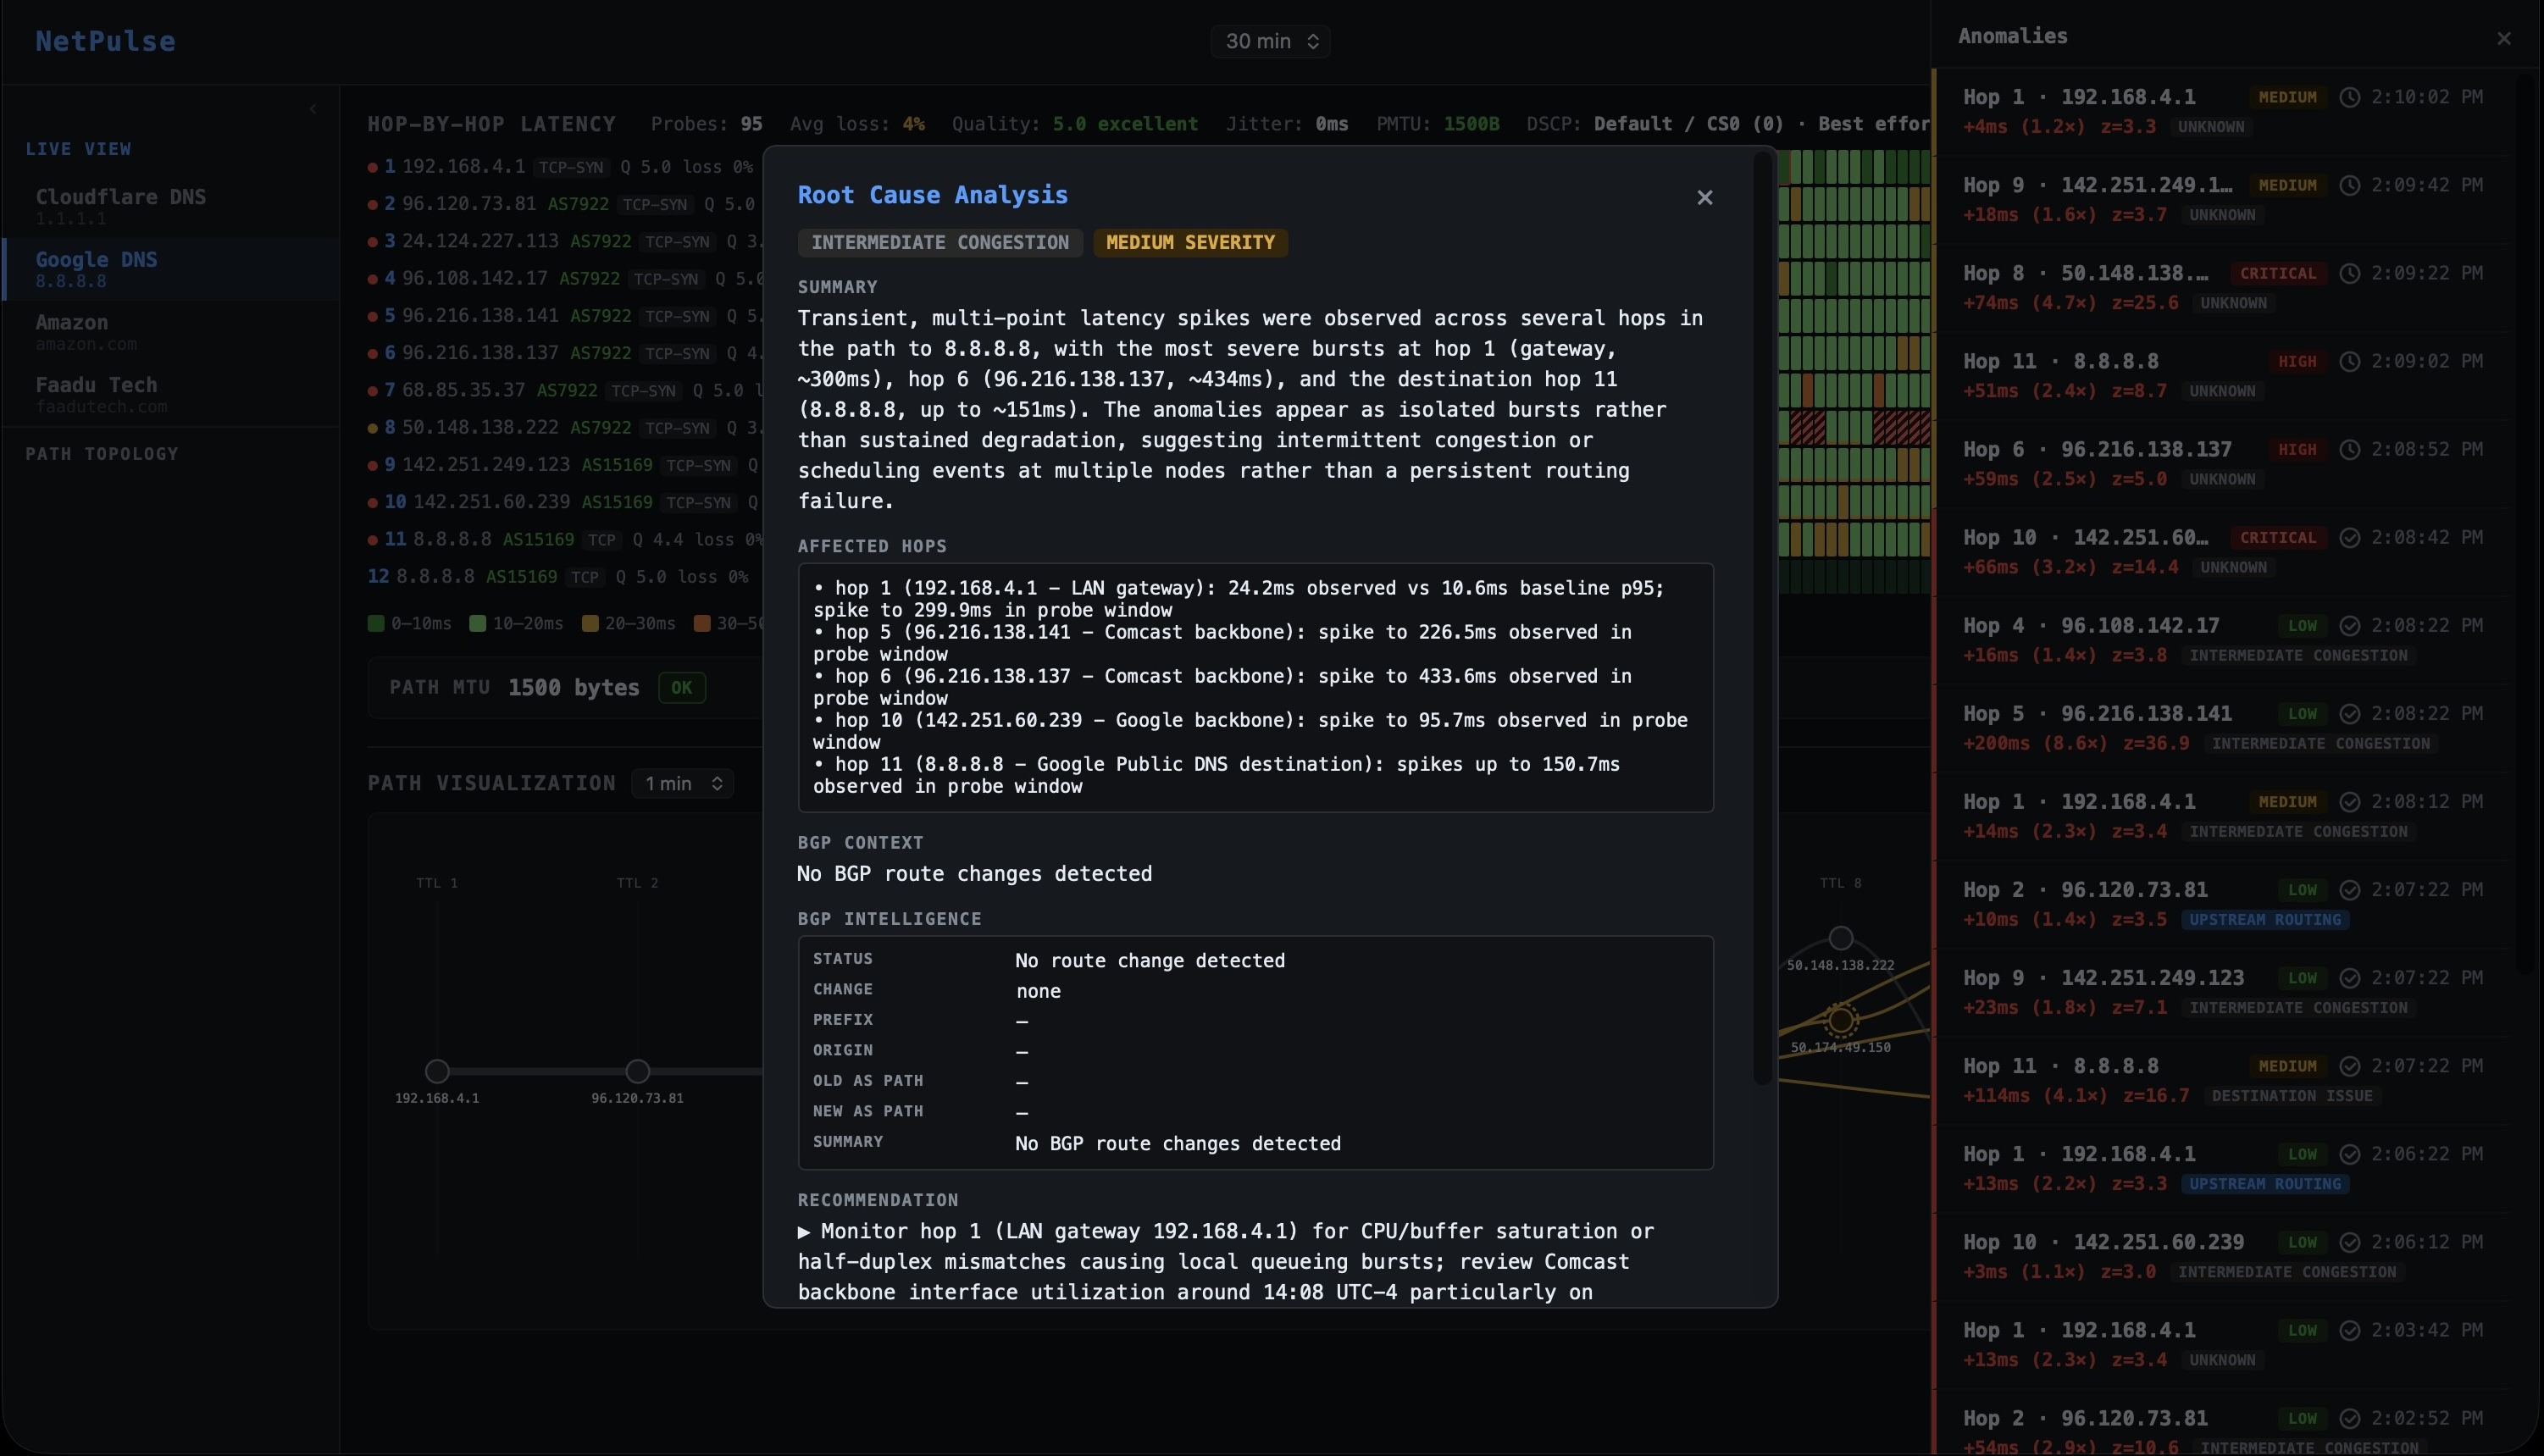
Automated RCA from anomaly to answer in under 60 seconds
Probe data, baseline deviation, BGP correlation, cross-tenant peer scope, and hop stability are assembled into a structured context and passed to the Claude API. The LLM is given a strict instruction: return structured JSON only. No prose essays, no hedging paragraphs. The JSON is rendered directly into the RCA card:
BGP correlation: RouteViews received a BGP UPDATE from AS7018 at 02:46:51 UTC 23 seconds before anomaly confirmation on prefix 8.8.8.0/24. AS7018 rerouted via AMS-IX Frankfurt, inserting AS6695 and AS5511 as additional transit hops. AS-PATH extended from 7018 → 15169 to 7018 → 6695 → 5511 → 15169. Path length increase is consistent with the observed latency delta.
Cross-tenant telemetry: 3 other NetPulse customers on AS7018 upstreams confirmed the same latency signature within the same 90-second window. This is not tenant-specific.
Total time from anomaly onset to RCA card rendered: approximately 41 seconds. The 90-second confirmation window is the dominant factor by design. The BGP correlation lookup takes <200ms against ClickHouse. The LLM call adds 2–4 seconds.
The RCA card is pushed simultaneously to the dashboard timeline (as a clickable anomaly band), the Slack alert (as a rich message with all tags), and the PagerDuty incident (in the description field). The engineer who gets paged receives the diagnosis in the same notification that woke them up before they've opened a laptop.
What this looks like for each team
For Network Engineers
The 3 AM page is the same. What changes is the 45-second read after it. By the time you open your laptop, NetPulse has already correlated the probe spike against the BGP feed, determined whether the degradation is internal or upstream, checked how many peer networks on the same ISP are affected, and written a recommended action. You either confirm "not us, monitoring" and go back to sleep or you see "INTERNAL · hop 2 · your AS" and know exactly where to start.
The BGP evidence stack UPDATE timestamp, prefix, old and new AS paths, peer count is already formatted for an ISP escalation. You don't write it from your incident notes at 4 AM. You copy it from the RCA card.
For Network Operations / NOC
The dashboard gives leadership a real-time network health view without requiring an engineer to translate it on a call. Every confirmed incident is stored with its full RCA summary classification, duration, peer scope, resolution timestamp. MTTR metrics are not self-reported; they're calculated from the anomaly detection and resolution timestamps in ClickHouse. The weekly digest surfaces the pattern: which targets degraded, which ISPs were responsible, how long before each resolved.
For SREs
When a service latency SLO is breaching, the first question is always: is this the application or the infrastructure? NetPulse answers the network half of that question with precision. A TCP Force SYN probe to the affected service's port shows whether the network-layer RTT is elevated. If it is, and it correlates with a BGP route change at hop 4, you've ruled out the application in under two minutes and you have the routing evidence to share with the network team. If the network RTT is nominal, the fault is in the application layer, and you stop investigating infrastructure.
DSCP probing adds another dimension for SREs managing real-time traffic. If your voice or video service degrades and DSCP probing shows EF latency converging with CS0 latency at a carrier hop, you've identified a QoS failure at the infrastructure level not a bug in your application.
The before and after
The network event is the same. The difference is in what happens to your team while it's occurring.
| Metric | Without NetPulse | With NetPulse |
|---|---|---|
| Time to classify internal vs. upstream | 30–90 minutes | ~41 seconds |
| Engineers required at 3 AM | 2–3 (war room) | 0–1 (read card, decide, sleep) |
| ISP escalation evidence | "Latency spiked around that time" | BGP UPDATE timestamp, prefix, AS-PATH before/after, peer count |
| SRE network triage | Manual traceroute + guesswork | TCP SYN RTT vs. service p99 network ruled in/out in 2 min |
| QoS visibility | None (static config, no verification) | Per-hop latency by DSCP class remarking detected in real time |
| MTU black hole detection | Found when a developer files a bug | Detected within 5-second probe window |
| BGP hijack detection | Not monitored | Immediate alert on new origin ASN no probe anomaly required |
| Alert noise | High static thresholds, many false positives | Low 2σ + PELT + 90s confirmation. Target: >85% genuine |
Stop writing "root cause: unknown."
If your team runs incident drills where the answer is "probably the ISP" and the evidence is "latency was high" NetPulse is the tool that changes that. Every incident. Every time.
Connect with me →